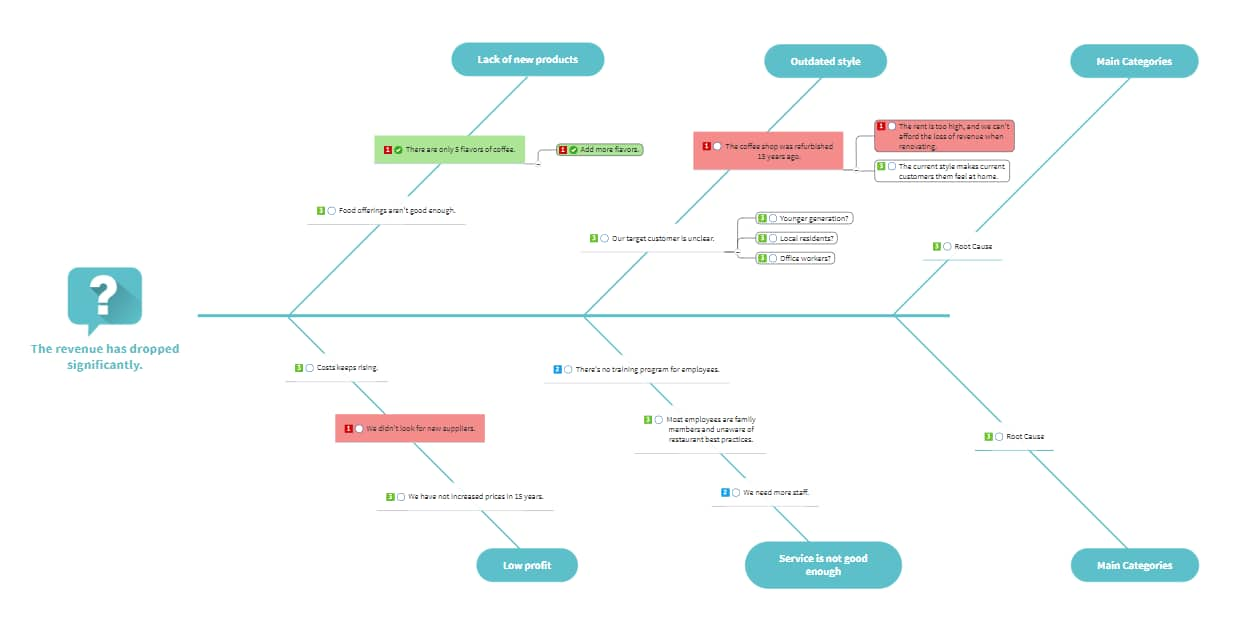
An Ishikawa diagram is designed to show the potential causes of a specific event or process. It is commonly used in product development to brainstorm and outline the different steps within a given process, allocate resources, and determine whether quality control issues are likely to arise.
The diagram is named after its creator, Kaoru Ishikawa. Visually, the diagram's structure resembles the skeleton of a fish. The ribs represent the causes of an event, and the skeleton's head indicates the outcome. Because of this structure, Ishikawa diagrams are sometimes referred to as fishbone diagrams. They are also referred to as Fishikawa, herringbone diagrams, or cause and effect diagrams.
An Ishikawa diagram places the central problem, known as the 'effect,' on the far right of the diagram. A line, known as the 'spine,' is drawn to the left, and other branches, which are types of causes known as 'affinities,' shoot off above and below it. Smaller branches can then be added to these affinities to add specific causes during brainstorming sessions.
The different types of Ishikawa diagrams include:
The 6M diagram organizes information into six categories: man, machine, material, method, mother nature, and measurement. It is most commonly used in the manufacturing industry. For instance, it could be used to identify bottlenecks slowing down the manufacturing process in a candle business.
The 8P diagram organizes information into eight categories: procedures, policies, place, product, people, processes, price, and promotion. It is most commonly used in the service industry. For instance, it could be used to improve the efficiency of a housekeeping business.
The 4S diagram organizes information into four categories: suppliers, systems, surroundings, and skills. It is most commonly used in the service industry. For instance, a restaurant could use it to determine why the number of customers has declined over the past year.
A simple fishbone diagram has no predetermined causes or categories of causes. This is useful for organizations that want to create and set their own unique affinities. For instance, a software company will have very different affinities to a pet food manufacturer.
The 3M diagram, also known as the 'man, machine, material' fishbone, organizes information into three categories: manpower, machinery, and materials. It is most commonly used in the manufacturing industry. For instance, it could be used in a food processing plant to determine why product quality has declined.
Ishikawa diagrams are a useful way to clearly visualize the potential causes of a specific event or problem. For instance, a team can use an Ishikawa diagram to identify bottlenecks or weaknesses within a business proposal and make the required adjustments.
Some popular use cases for Ishikawa diagrams include:
Ishikawa diagrams are often used in product development to outline the steps involved in the process clearly. This helps teams to determine which resources will be required at specific times and can also help to identify potential quality control issues.
Organizations often use Ishikawa diagrams to troubleshoot processes and resolve problems within a system. This is because the diagram makes it easy to consider all the possible causes of an issue within each category.
For instance, the 4S's diagram suggests that the possible causes could be related to suppliers, systems, surroundings, or skills.
Ishikawa diagrams are often used to identify the underlying cause of a failure in a product or process.
Problem-solving teams should first create a problem statement that includes information such as: what product failed, failure observations, the number of failed units, and the customer's description of the failure.
They should then create an Ishikawa diagram, which visually depicts the hypotheses that could explain this failure. The diagram elements should help explain what was responsible for the failure.
Some of the key benefits of Ishikawa diagrams include:
Showing all of the causes in the chain illustrates every possible reason that could lead to a problem simultaneously.
Even if the solution isn't immediately obvious, having a clear visualization makes it possible to eliminate some false positives quickly. This can stimulate team members to work out the potential causes of a problem more quickly.
Ishikawa diagrams make it easy to understand the correlation between relationships. This makes it obvious when certain stages of the process restrict the system's flow. As a result, any weakness or potential bottlenecks can quickly be identified and monitored before they cause issues.
Given that Ishikawa diagrams provide an overview of all the potential causes of a certain result, it facilitates brainstorming, which can accelerate problem-solving. It also helps teams maintain their focus because it provides a clear pathway to analyze every involved pathway.
Here is how you can create an Ishikawa fishbone diagram in four easy steps.
You can make Ishikawa diagrams by hand or in any graphic design program or use a program specifically designed for Ishikawa diagram making. MindManager, an industry-leading Ishikawa diagram software, allows you to create complex, detailed Ishikawa diagrams with ease.
MindManager's key benefits include:
MindManager helps you synthesize ideas and information by providing a simple, intuitive framework for organizing your thoughts. With MindManager, you and your team can clarify complexity and collaborate in new and unexpected ways.
MindManager comes pre-installed with many Ishikawa diagram templates. To use these templates:
An Ishikawa diagram shows the potential causes of a specific event or process.
An Ishikawa diagram is typically used in manufacturing and product development to outline the sequence of steps in a process. This can help teams identify a problem's potential causes, reveal areas of weakness or bottlenecks in current processes, and accelerate problem-solving.
Ishikawa diagrams are designed to show the potential causes of a specific event or process. They are typically used during product development, root cause analysis, and troubleshooting processes.
They can help your organization to identify the potential causes of a problem, reveal areas of weakness or bottlenecks in current processes, and ultimately accelerate problem-solving within teams.
Want to visualize your processes and remove the bottlenecks within your organization? Give MindManager a try today and start building Ishikawa diagrams with our easy-to-use templates.